Design of a locally producible box for photographing TLC plates under UV illumination
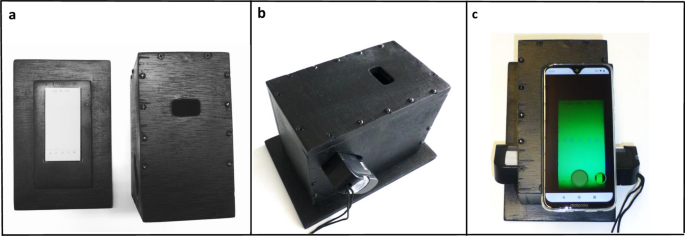
In TLC analysis with the GPHF Minilab, the spots of the APIs are most commonly visualized by their fluorescence quenching under UV illumination. For photography of such TLC plates under standardized conditions, the 3D-printed cradle described by Yu et al.41 was modified here with three aims: (1) creating a design which is locally producible in low-resource settings; (2) better protection of the UV-illuminated TLC plate from ambient light, to improve image quality; (3) usability with smartphones of different sizes. Several designs were developed and tested, resulting in the one depicted in Fig. 1. The wooden box is painted in matte black colour to minimize reflections. It consists of a bottom plate which accommodates the TLC plate in a marked rectangle, and of a box-shaped lid. The lid has openings in the sides for insertion of the battery-operated UV lamp supplied with the GPHF Minilab. A third opening located in the flat upper side enables capturing the TLC plate with any rear-facing smartphone camera. Precise drawings for the construction of the box are given in Supplementary Fig. S2. The box was produced in a workshop of the University of Tübingen, and was subsequently reproduced by a commercial workshop in Germany (see “Methods”), and by a carpenter in Zimbabwe (Supplementary Fig. S5). We found this box to offer easier handling, better protection from ambient light, and cheaper production than the 3D-printed cradle described by Yu et al.41.
Box for photography of TLC plates under UV illumination. (a) Left: Bottom plate with TLC plate. Right: box-shaped lid with openings for the UV lamp and for photography. (b) Assembled box with the UV lamp inserted. (c) Assembled box with TLC plate, UV lamp, and smartphone.
Development of a smartphone-based image processing algorithm for quantitative evaluation of TLC analysis
A new image processing algorithm, named “TLCyzer” was developed for this study. Details of the algorithm are described in the Methods section, and the general processing steps are visualized in Fig. 2a–h. Due to the high-performance Rust47 implementation the entire processing and analysis of the image can be run on any modern smartphone with short analysis times, aiding the practical on-site capture and analysis setup. The image analysis can be compiled for various operating systems and future ports of the application to Apple’s iOS or Windows systems are easily possible without any modification to the analysis. The analysis will remain consistent between various operating systems and devices.
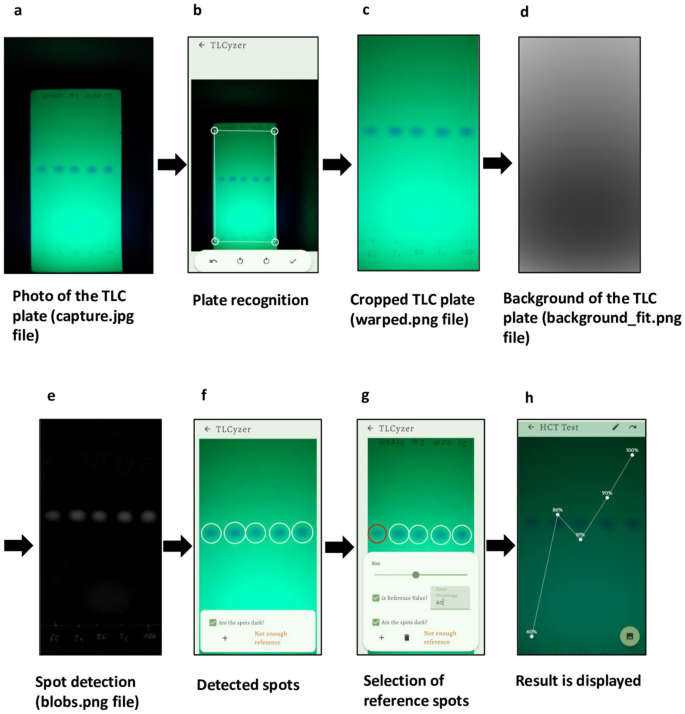
Multi-stage capture and processing pipeline of a photo of a TLC plate in the TLCyzer imaging application. The TLC plate is photographed (a) and the outlines of the plate are defined, perspectively warped, and cropped (b,c). The background is then fitted on the result and removed from the grayscale input (d). The result leaves only the blobs, which are detected by thresholding and connected component analysis (e). The now detected spots (f) are then integrated, and content value (= percentage) is manually entered for each reference spot (g). By fitting a linear function, the contents (= percentages) of the unknown samples are evaluated (h). A spotting pattern with three reference solutions (60, 80 and 100%) was used in this TLC plate (see Supplementary Fig. S1).
The TLCyzer app is available free of charge as GPL open-source software (see “Methods”). Instructions for download and use of the app are provided in Supplementary Fig. S3. For the evaluation of a TLC photo with the app, manual user inputs are required for: (i) entering the name or number of the sample; (ii) cropping of the photo, i.e. correct positioning of the four corner points of the image to be evaluated; (iii) if necessary, correction of the automatic detection of the TLC spots; (iv) if necessary, deletion of any unwanted contaminant spots which may have been automatically detected by the app; (v) defining which of the spots are references, and entering their respective concentrations. The app allows the use of two or more reference solutions of any concentration, enabling the user to tailor the analytical procedure to her/his needs.
Tapping the appropriate symbol on the smartphone screen starts the calculation, which takes less than 1 s. The results for all sample and reference spots are subsequently displayed on the screen (Fig. 2h and Supplementary Fig. S3). Intentionally, results are given on the smartphone screen only as integer percentage values in order to avoid exaggerated expectations about the precision of this low-cost screening tool.
Folders containing the original photos and all data generated in the evaluation are saved on the smartphone. The evaluation does not require an internet connection, which is important in low-resource settings where access to the internet is often limited or unreliable. However, once an internet connection is available, the folders can be shared as ZIP files (size approximately 5 MB) using instant messaging apps (like WhatsApp or Signal) or e-mail, and uploaded to a cloud (Supplementary Fig. S3). This enables rapid sharing of TLC photos and of analysis results between personnel in the field and senior staff, as well as re-evaluation of TLC photos of suspicious samples by scientifically trained researchers in any geographical location. Of course, the ZIP files can be uploaded from the smartphone to a computer using a cable or Bluetooth connection. These files contain the calculated percentage values with several digits after the decimal point.
Requirements and costs of medicine analysis with the TLCyzer app
Requirements and costs for medicine analysis with the GPHF Minilab have been evaluated previously31. Quantitative medicine analysis with the TLCyzer app requires, in addition to a GPHF Minilab, the above-described box for photo-taking. This has been produced by a German workshop (see “Methods”) for 69 € (78 US$) per box. A local carpenter in Mutare, Zimbabwe, produced a single box even for 36 US$. This compares favourably to the 130 US$ stated by Yu et al.41 as cost of their 3D-printed box. Furthermore, a smartphone with rear-facing camera is required, which must be Android-based for the current version of the app. In the present evaluation, TLC photography and image analysis were carried out with a low-priced smartphone model (see “Methods”), purchased for 250 € (284 US$). Use of the app does not require any further equipment or consumables. Provided that the smartphone is charged, and batteries for the UV lamp of the GPHF Minilab are available, no power connection is required.
Accuracy and repeatability of quantification with the TLCyzer app
The accuracy (“trueness”) of an analytical procedure is the closeness of the test result to the true value, and should be reported as percent recovery of known amounts of the analyte in the sample46. Precision is the degree of agreement of individual test results when the procedure is applied repeatedly to multiple samplings of a homogeneous sample, and is usually expressed as standard deviation (SD) or relative standard deviation (RSD). “Repeatability” refers to the precision of repetitions carried out within a short period of time, by the same person and using the same equipment. In contrast, “intermediate precision” expresses within-laboratory variations, e.g. between analyses carried out on different days, using different equipment, or by different persons. Both repeatability and intermediate precision were assessed in the present performance evaluation.
14 APIs (Table 1) representing both medicines against infectious diseases and against non-communicable diseases were selected based on (i) their importance for health care in Africa36,48, (ii) the availability of monographs for their analysis in the GPHF Minilab manual49, and (iii) the possibility of their detection under UV light. As explained in the “Intermediate precision” section, from each API three solutions of different concentrations were prepared and spotted onto two lanes of each of two TLC plates, next to appropriate reference solutions. The APIs sulfamethoxazole and trimethoprim were combined in the solutions, in accordance with their fixed combination in cotrimoxazole preparations. Representative photos of the TLC analysis of all 14 APIs are depicted in Supplementary Fig. S4. The sample spots were quantified using the TLCyzer app. The resulting values are displayed graphically in Fig. 3. All individual measurements are listed in Supplementary Table S2, and the results are summarized in Table 2.
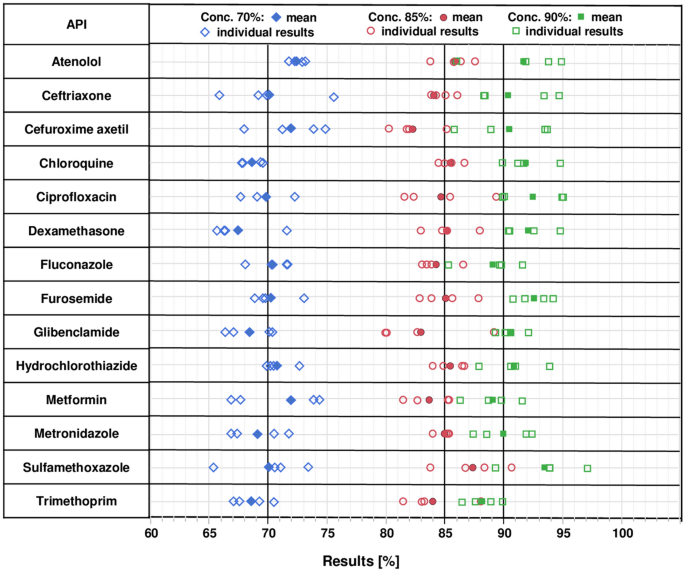
Individual and mean (n = 4) results of the quantitative determination of 14 active pharmaceutical ingredients with the TLCyzer app. For each API, three test solutions containing 70%, 85% and 90% of the standard concentration given in Table 1 were prepared and analysed four times by TLC and image analysis (see “Methods”). These results are further evaluated in Table 2, and the numerical values of all individual measurements are listed in Supplementary Table S2.
Accuracy, expressed as mean recovery for each of the test solutions, was 100.3% on average (range 96.8–103.9%). Repeatability, expressed as RSD, was 2.79% on average, and ranged from 1.59 to 3.84% for the 14 tested APIs (Table 2). The highest RSD was observed for sulfamethoxazole. Sulfamethoxazole gives quite large spots, since the concentrations given in the GPHF Minilab manual are optimized for parallel detection of both sulfamethoxazole and the minor component trimethoprim in the analysis of cotrimoxazole preparations. The large sulfamethoxazole spots were often not recognized automatically by the TLCyzer app and required manual spot detection.
Contrary to our expectations, APIs giving only faint spots in the TLC analysis, such as atenolol and trimethoprim (Supplementary Fig. S4), did not show higher RSDs (Table 2).
Intermediate precision
The following intra-laboratory variations were introduced: photographs of the TLC plates were taken on two different days; a total of three different photos were taken of every plate; the TLCyzer evaluation of these photos was carried out by three different investigators, each one using a different smartphone model (see “Methods”). As recommended by the ICH guidelines46, the effects were evaluated within an experimental matrix design using a random combination of the above-mentioned variations, as explained in the “Methods” section. Table 3 shows a summary of the results, and Supplementary Table S3 lists the results of each individual measurement. The most experienced investigator (C.H.), who had already carried out the investigation of the repeatability, obtained results with an RSD of 3.50%, slightly higher than the RSD of 2.79% observed in the repeatability experiment and likely to reflect the expected effect of introduced variations. The results of the two other investigators (undergraduate students Y.W. and J.G.) showed higher RSDs (4.32% and 5.45%, respectively) than those of investigator C.H., most likely reflecting the lesser degree of their training in the use of the TLCyzer app. As shown in Table 3, the average RSD including all three investigators with all 14 APIs resulted as 4.46%.
Among the 14 APIs, the highest RSD (8.02%) was again observed for sulfamethoxazole. Among all the 336 individual measurements, the recovery results ranged from 84.9 to 113.7% of the true value, i.e. over a wider range than the 168 individual measurements for repeatability (93.4–107.0%), consistent with the expected effect of the introduced variations.
Linearity
Linearity is the ability to obtain test results that are proportional to the concentration of the analyte in the sample across a given range46. For each of the 14 APIs, solutions of five different concentrations were prepared and analysed as described in the “Methods” section. As recommended by the ICH guideline46, plots of the results are depicted in Fig. 4 with y-intercepts (i), slopes of the regression lines (s), the correlation coefficients (R), determination coefficients (R2) and residual sums of squares (RSS). All individual test results are listed in Supplementary Table S4. The test results were proportional to the concentrations of the analyte for all 14 APIs in the investigated range, with determination coefficients R2 between 0.989 and 1.00. The data in Supplementary Table S4 again confirm the accuracy of the method (mean recovery 100.1%), and its precision (average RSD 1.99%). Among all the 210 individual measurements listed in Supplementary Table S4, the recovery results ranged from 92.1 to 109.0% of the true value.
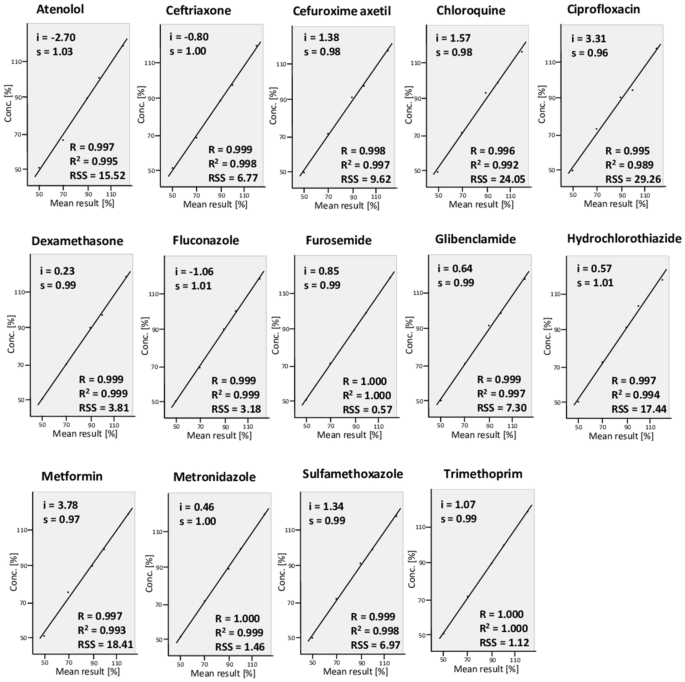
Linearity plots of the quantitative determination with the TLCyzer app. Solutions containing 50–120% of the standard concentrations given in Table 1 were prepared, and each was analysed in triplicate. The y-intercepts (i), slopes of the regression lines (s), the correlation coefficients (R), determination coefficients (R2) and residual sums of squares (RSS) are indicated. The individual measurements are listed in Supplementary Table S4.
Range
The above data on linearity prove that the quantification with the TLCyzer app has suitable levels of accuracy, precision and linearity for all 14 investigated APIs in the range from 50 to 120% of the declared API content of a pharmaceutical product, i.e. in the range most relevant for the assessment of medicine quality. To investigate whether also lower amounts of API can be accurately quantified, three test solutions of sulfamethoxazole and trimethoprim containing only 12–15% of the standard concentrations were prepared and analyzed as described in the “Methods” section. A photo of one of the resulting TLC plates is included in Supplementary Fig. S4. The spots of trimethoprim are very faint under these conditions. However, TLCyzer analysis of these photos still quantified trimethoprim correctly with a mean recovery of 100.9%. The observed RSD of 5.2% (n = 12) was approximately twice as large as the RSD of 2.5% (n = 12) obtained with the higher trimethoprim concentrations (Table 2).
Robustness
The robustness of an analytical procedure is a measure of its capacity to remain unaffected by small deliberate variations in procedural parameters, and provides an indication of the procedure’s suitability during normal use21,46. Four different APIs (chloroquine, dexamethasone, hydrochlorothiazide and metformin) were selected to for the evaluation of robustness. As explained in the “Methods” section, they were analysed under the standard conditions, but also under seven modified conditions representing small deliberate variations (Table 4): including or excluding different parts of the TLC photos (Supplementary Fig. S1); using manual spot detection, rather than automatic spot detection by the app; shifting the UV lamp out of its central position in the box (2 cm to the left); using batteries with low charge (ca. 1.3 V) for the UV lamp; using a different model of the box for photo-taking (i.e. the box depicted in Supplementary Fig. S5a); and using a different smartphone for TLC photography and TLCyzer evaluation (see “Methods”). The results are summarized in Table 4, and the individual results of all measurements are listed in Supplementary Supplementary Table S5. Overall, accuracy and precision were hardly affected by the deliberate modifications: the values for mean recovery (100.9%) and for average RSD (2.60%) were nearly identical to those determined for these four APIs under standard conditions (recovery 100.2%; RSD 2.43%; calculated from the values shown in Table 2). Only one modification led to a conspicuously increased RSD (3.99%), namely the shift of the UV lamp out of its central position which results in a stronger illumination of the left side of the TLC plate. Indeed, closer examination of the results showed that under these conditions average recovery for the left sample spot was higher by 5.8% than for the right sample spot on the same plate. This shows the importance of the central positioning of the UV lamp.
Among all 192 individual measurements in this experiment, the recovery values ranged from 91.1 to 110.2%, with the highest deviation observed for a measurement carried out with a non-central position of the UV lamp.
Specificity: analysis of finished pharmaceutical products
Specificity is the ability to assess the analyte, with a suitable level of accuracy and precision, also in the presence of other components that may be present21,46. The specificity of the GPHF Minilab in the qualitative identification of APIs has been investigated previously13,31,34,36. In the present evaluation, tablets of ciprofloxacin, dexamethasone, hydrochlorothiazide and metronidazole were obtained from the pharmacy of the Tübingen University Hospital, and were analysed to evaluate accuracy and precision of the quantification with the TLCyzer app in the presence of matrix components (see “Methods”). In addition, the API contents of the four products were determined by HPLC according to the methods of USP 42. The contents were found to be compliant with USP 42 specifications (Supplementary Table S6).
As shown in Supplementary Table S6, accuracy of the quantification with the TLCyzer (mean recovery 99.5%) was only slightly lower, and the average RSD (3.38%) was only slightly higher, than the values determined with the respective solutions of the pure APIs (i.e. mean recovery 100.2%; average RSD 2.64%; calculated from the values in Table 2). This suggests that the quantitative evaluation with the TLCyzer app was not affected by matrix components of the investigated tablets.
Use of the TLCyzer app in the analysis of substandard medicines collected in the DR Congo
As a first experiment to evaluate the performance of the app in the analysis of actual substandard medicines, we tested two samples of substandard tablets, i.e. ciprofloxacin 500 mg tablets and metronidazole 250 mg tablets, which we had collected in the course of a medicine quality study in the DR Congo36. These were analysed by HPLC according to the methods of USP 42, resulting in a content of only 83.4% and 86.7% of the declared amount of the API, respectively36. Therefore they failed the specifications of USP 42 which demands a content of 90–110% of the declared amount. These two samples were now analysed with the TLCyzer app. The results (84.2% for the ciprofloxacin sample; 86.0% for the metronidazole sample) were in remarkably close agreement with the values determined by HPLC). For the substandard ciprofloxacin (API content 83.4% of the declared amount), all 12 individual measurements obtained with the TLCyzer app showed a content lower than 90% of the declared amount of the API (Supplementary Table S6), correctly identifying the sample as OOS. For the substandard metronidazole (API content 86.7%), 11 of the 12 individual measurements correctly identified the sample as OOS, while one measurement was above 90% and incorrectly suggested the sample to be within specification. For the four good-quality products obtained from the Tübingen University hospital pharmacy, 46 of the 48 individual measurements correctly identified the samples as in-specification. However, for hydrochlorothiazide tablets (API content 93.3%), two individual measurements were below 90%, incorrectly suggesting the sample to be OOS (Supplementary Table S6). A correct identification of all substandard products as OOS, and all good-quality products as in-specification, was obtained when the mean results from two different TLC plates, or just two different photos of the same TLC plate, were used for calculation.
Simplified spotting pattern: 80% and 100% reference solutions only
Despite the use of simple, low-cost equipment (standard TLC plates; manual spotting of sample and reference solutions; low-cost smartphone camera), the quantification with the TLCyzer app had shown quite good accuracy and precision, exceeding our original expectations. This encouraged us to test a further simplification, i.e. the use of only two reference solutions, containing 80% and 100% of the standard concentrations shown in Table 1, respectively. This allows one to strictly follow the instructions of the GPHF Minilab manual49 both in the preparation of the reference solutions and in the spotting pattern on the TLC plate (Supplementary Fig. S1). The solutions prepared for the above described investigation of four good-quality products and two substandard products were used for this experiment. The results from the good-quality medicines (98.9% recovery; 3.60% average RSD; see Supplementary Table S7) were very similar to those obtained with the previous procedure using three reference solutions (99.5% recovery; 3.38% average RSD; see Supplementary Table S6). The same was true for the results of the substandard products. The discrimination between in-specification and OOS medicines was even more precise using the simplified spotting pattern: for the four good-quality products, all 48 individual measurements correctly identified the samples as in-specification. For the two substandard products from the DR Congo, 23 out of the 24 individual measurements correctly identified the sample as substandard; only for the metronidazole tablets (API content 86.7% of the declared amount), one individual measurement was slightly above the 90% threshold (i.e. 90.3%).

